Usage example
Source:usage.md
RamanD2O supplies a small dataset for testing.
1. Load data
Just click “Quick start, click here to load a small demo dataset.”, a small dataset with 25 spectra will be loaded. This dataset can be grouped using metadata columns “Timepoint” or “Label”. There are three groups: I245_0mM, I245_0.5mM, and I245_1mM.
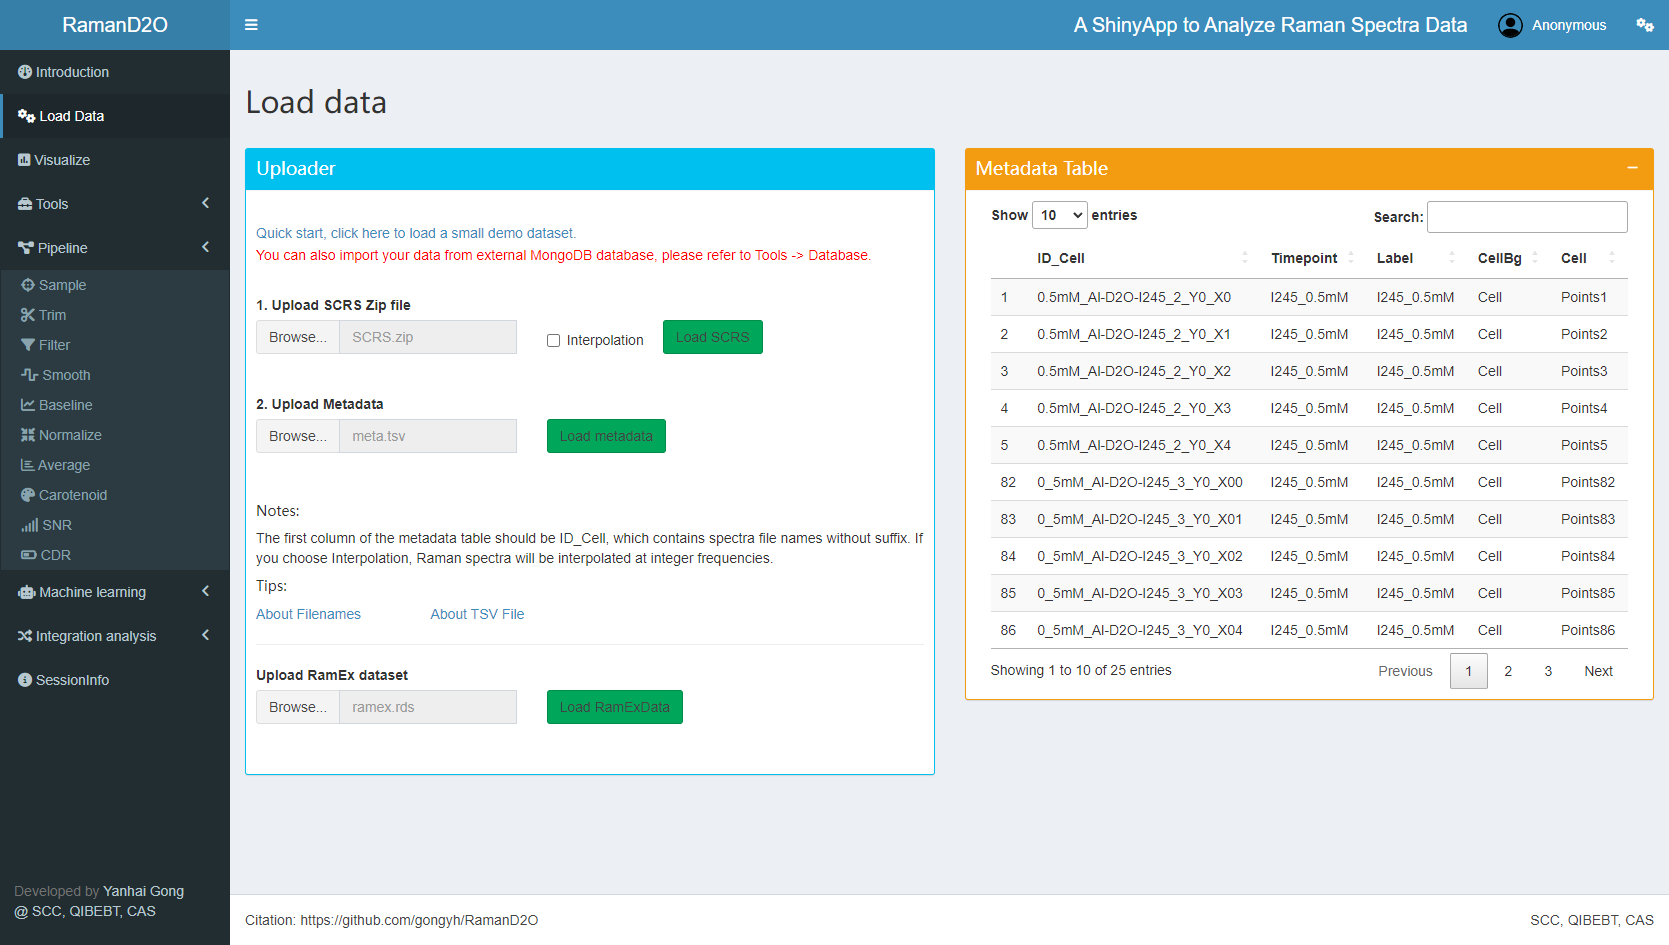
User interface of Data Loader
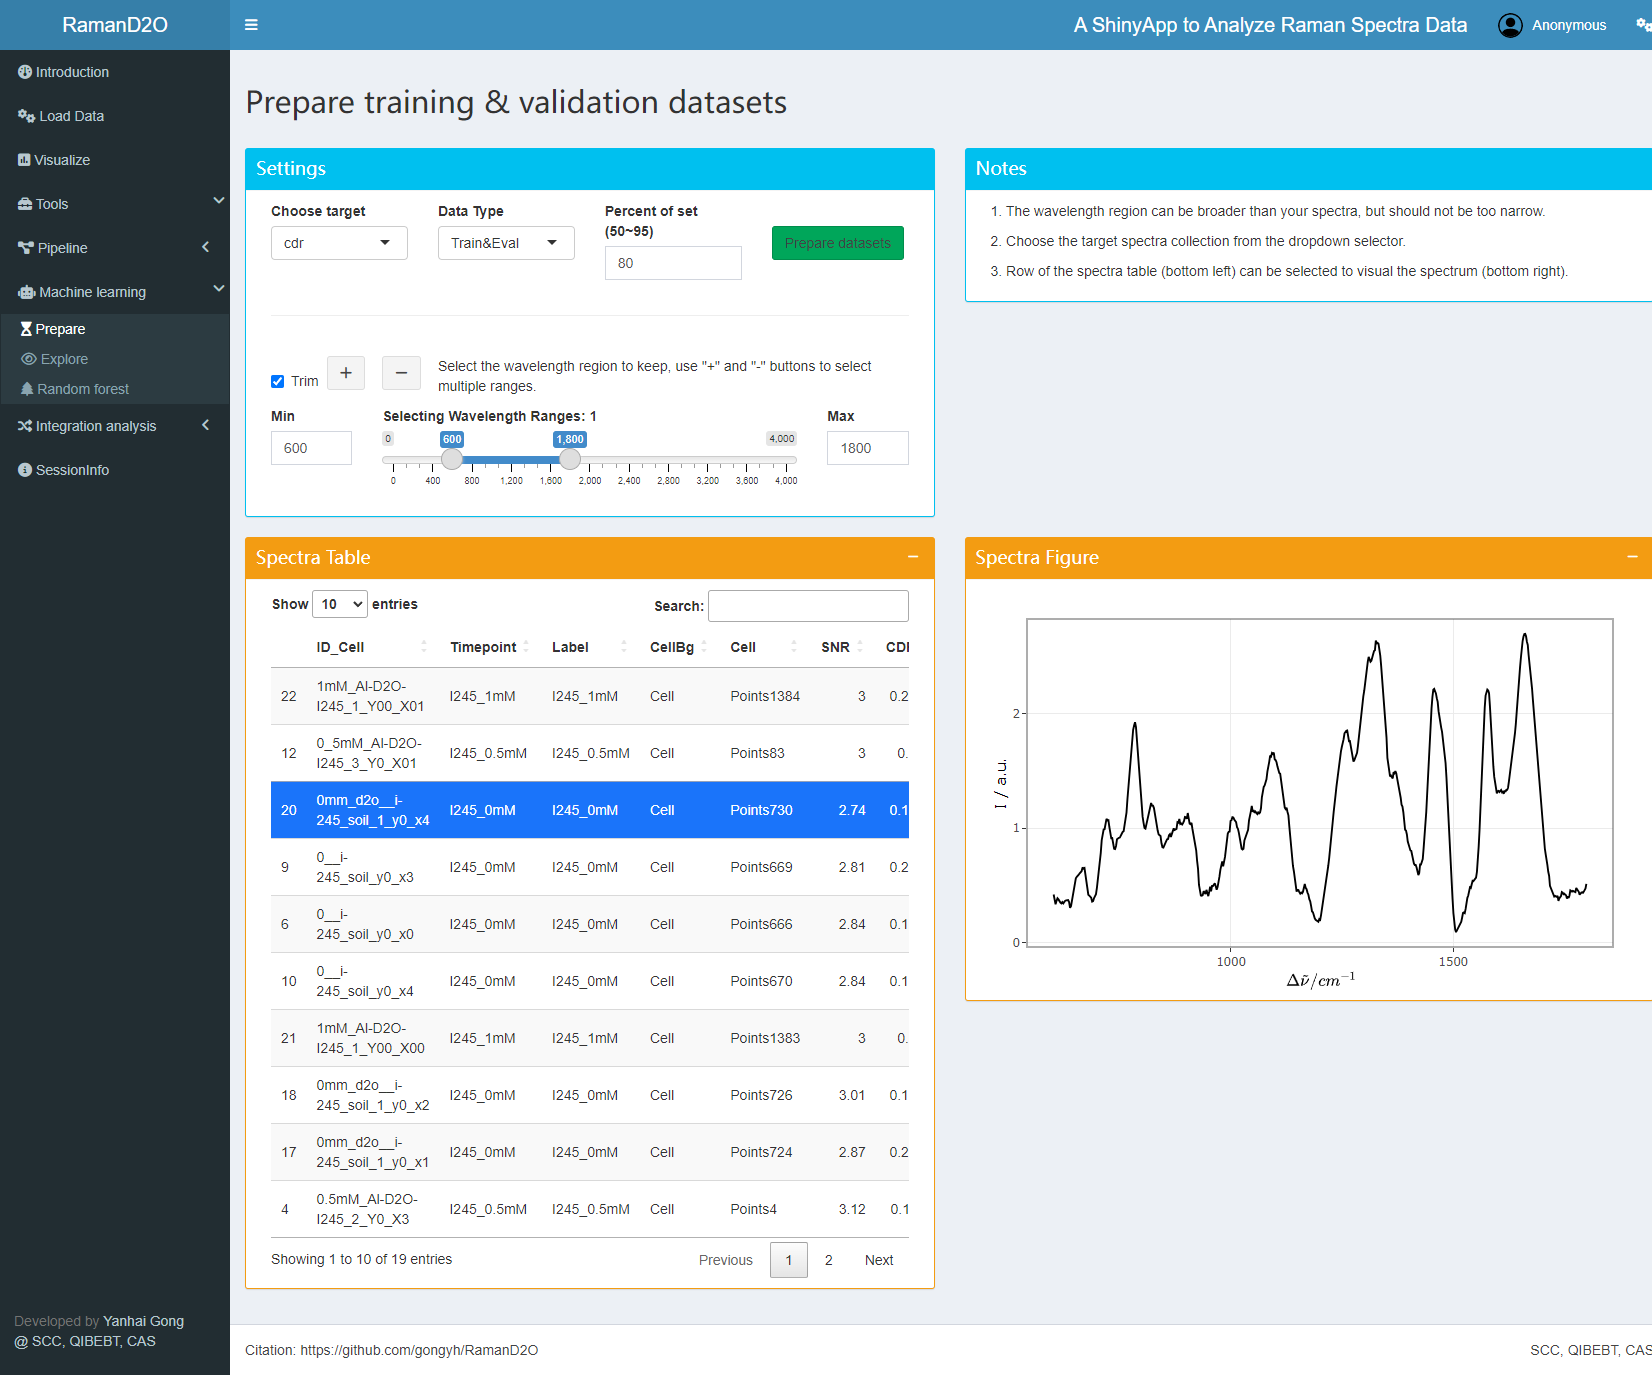
2. Trim wavelength
Raman shift of 450~3100 cm-1 are kept for subsequent analysis.
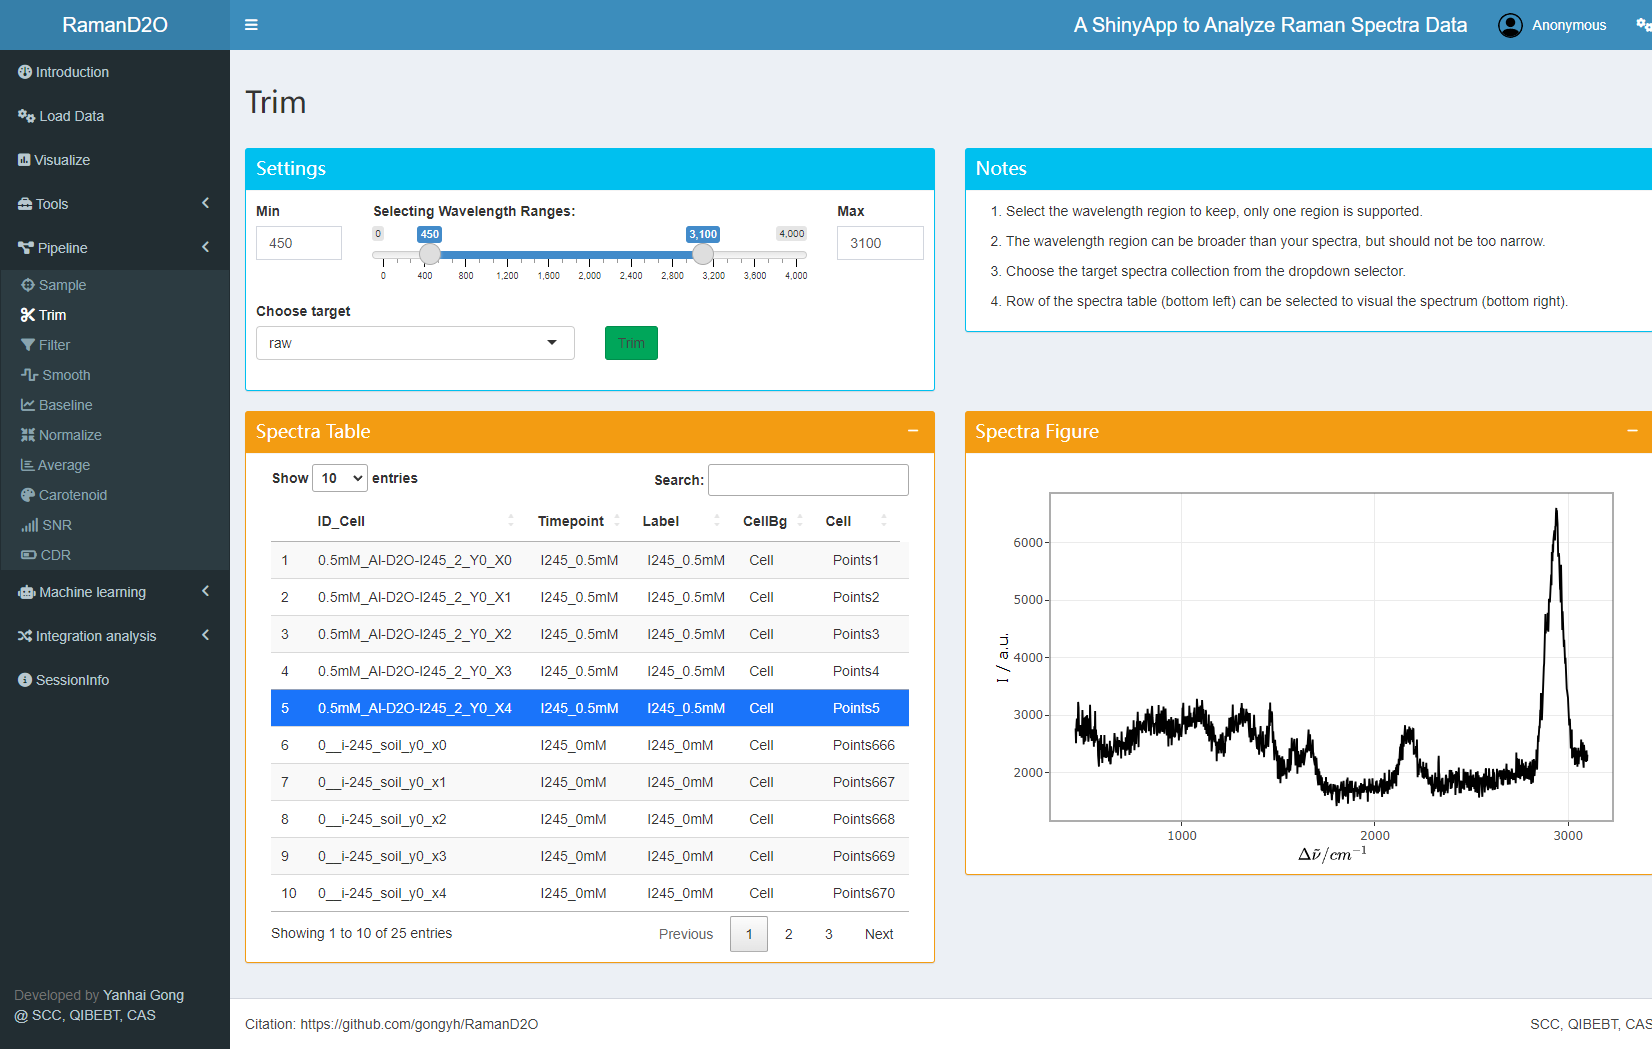
User interface of Trim
3. Spectra smoothing
Raman spectra are smoothed using SG method to increase SNR.
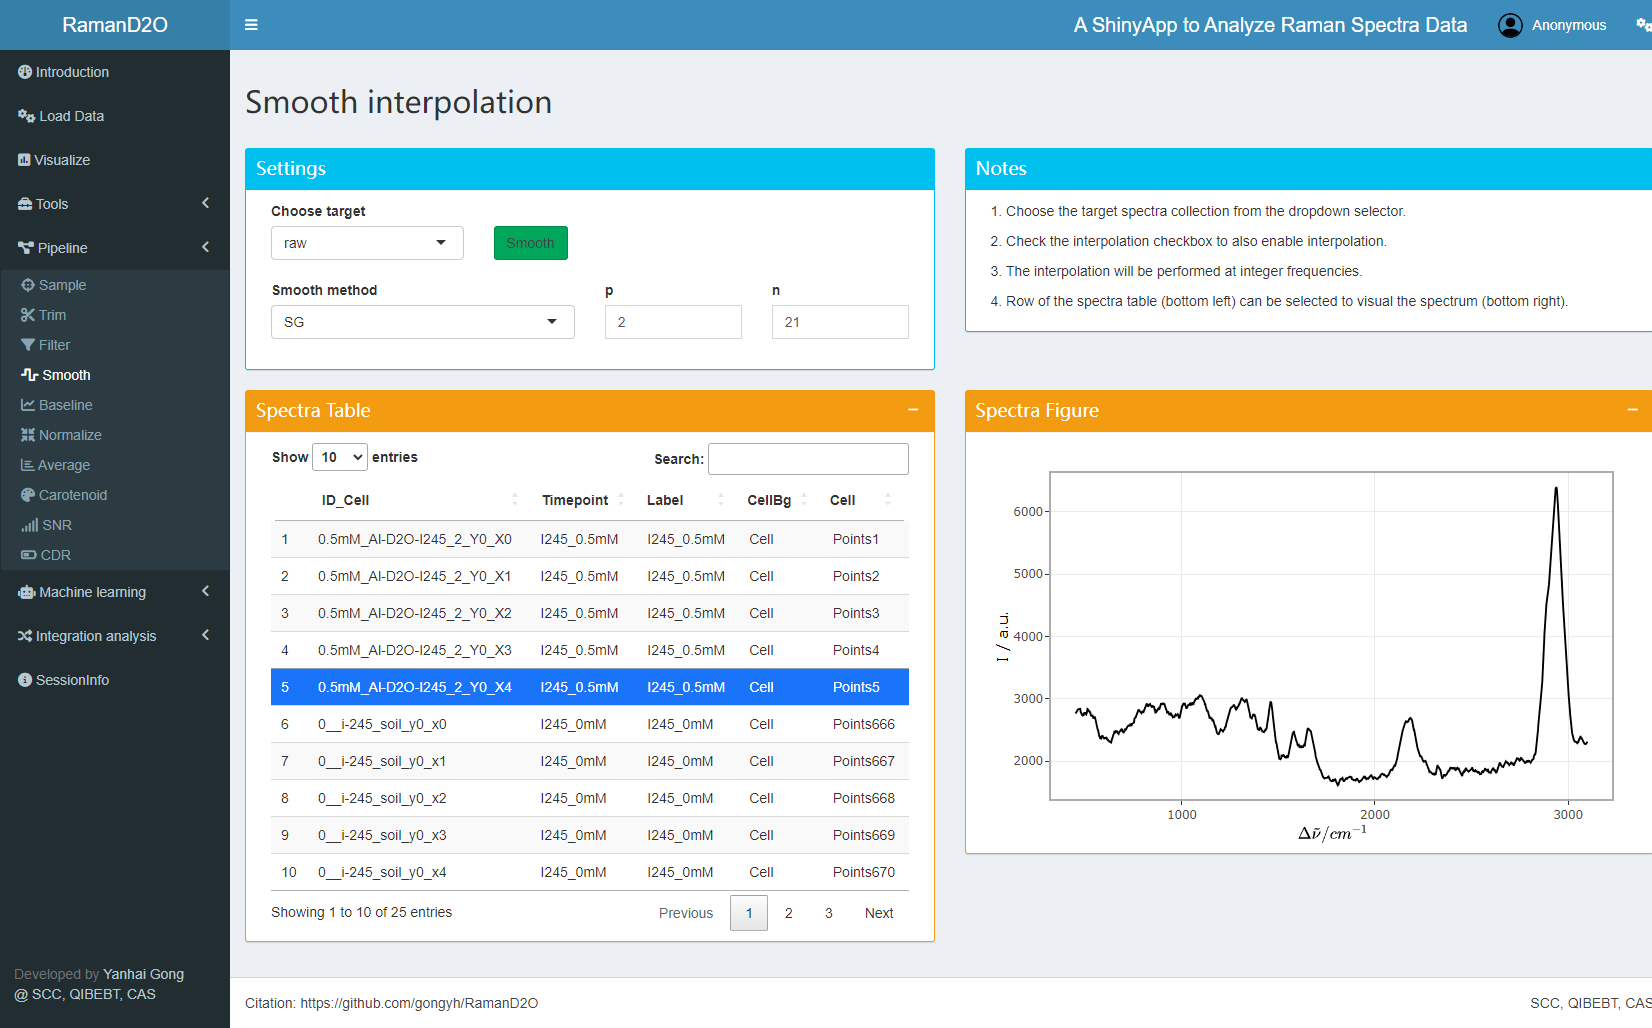
User interface of Smoothing
5. Normalization
Raman spectra are normalized according the area of “Fingerprint” region.
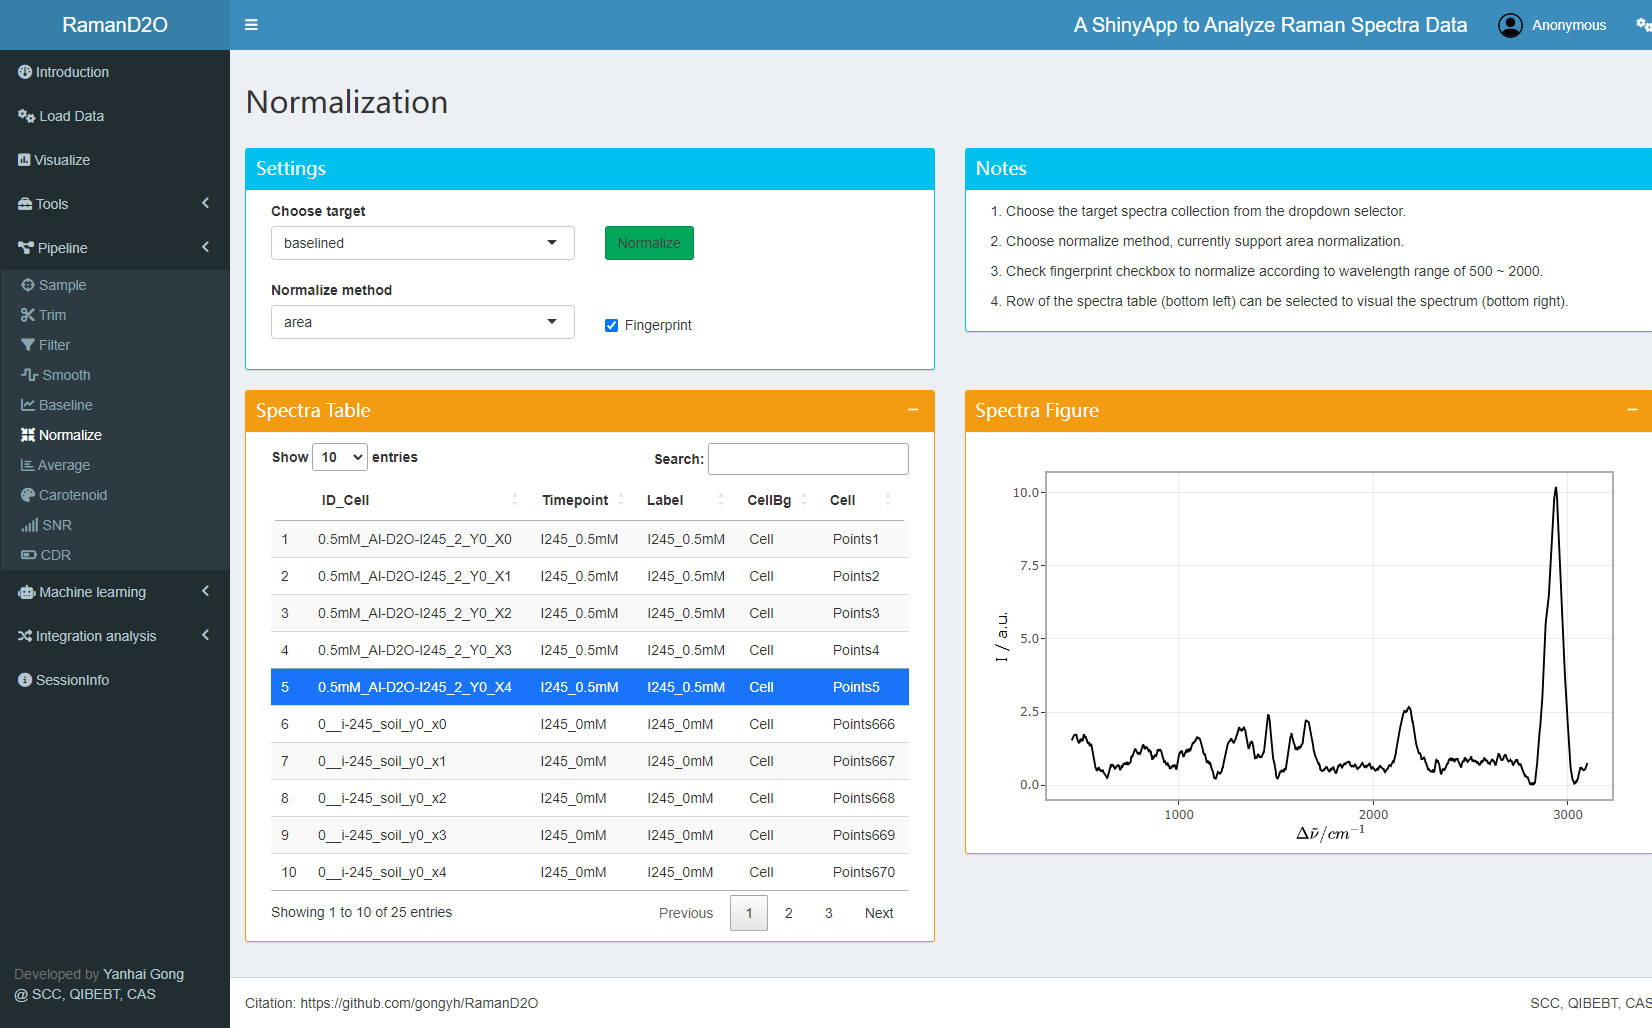
User interface of Normalization
6. SNR calculation
SNR of each Raman spectra is calculated using the “new” method. Low-SNR spectra with SNR<2.5 are removed.
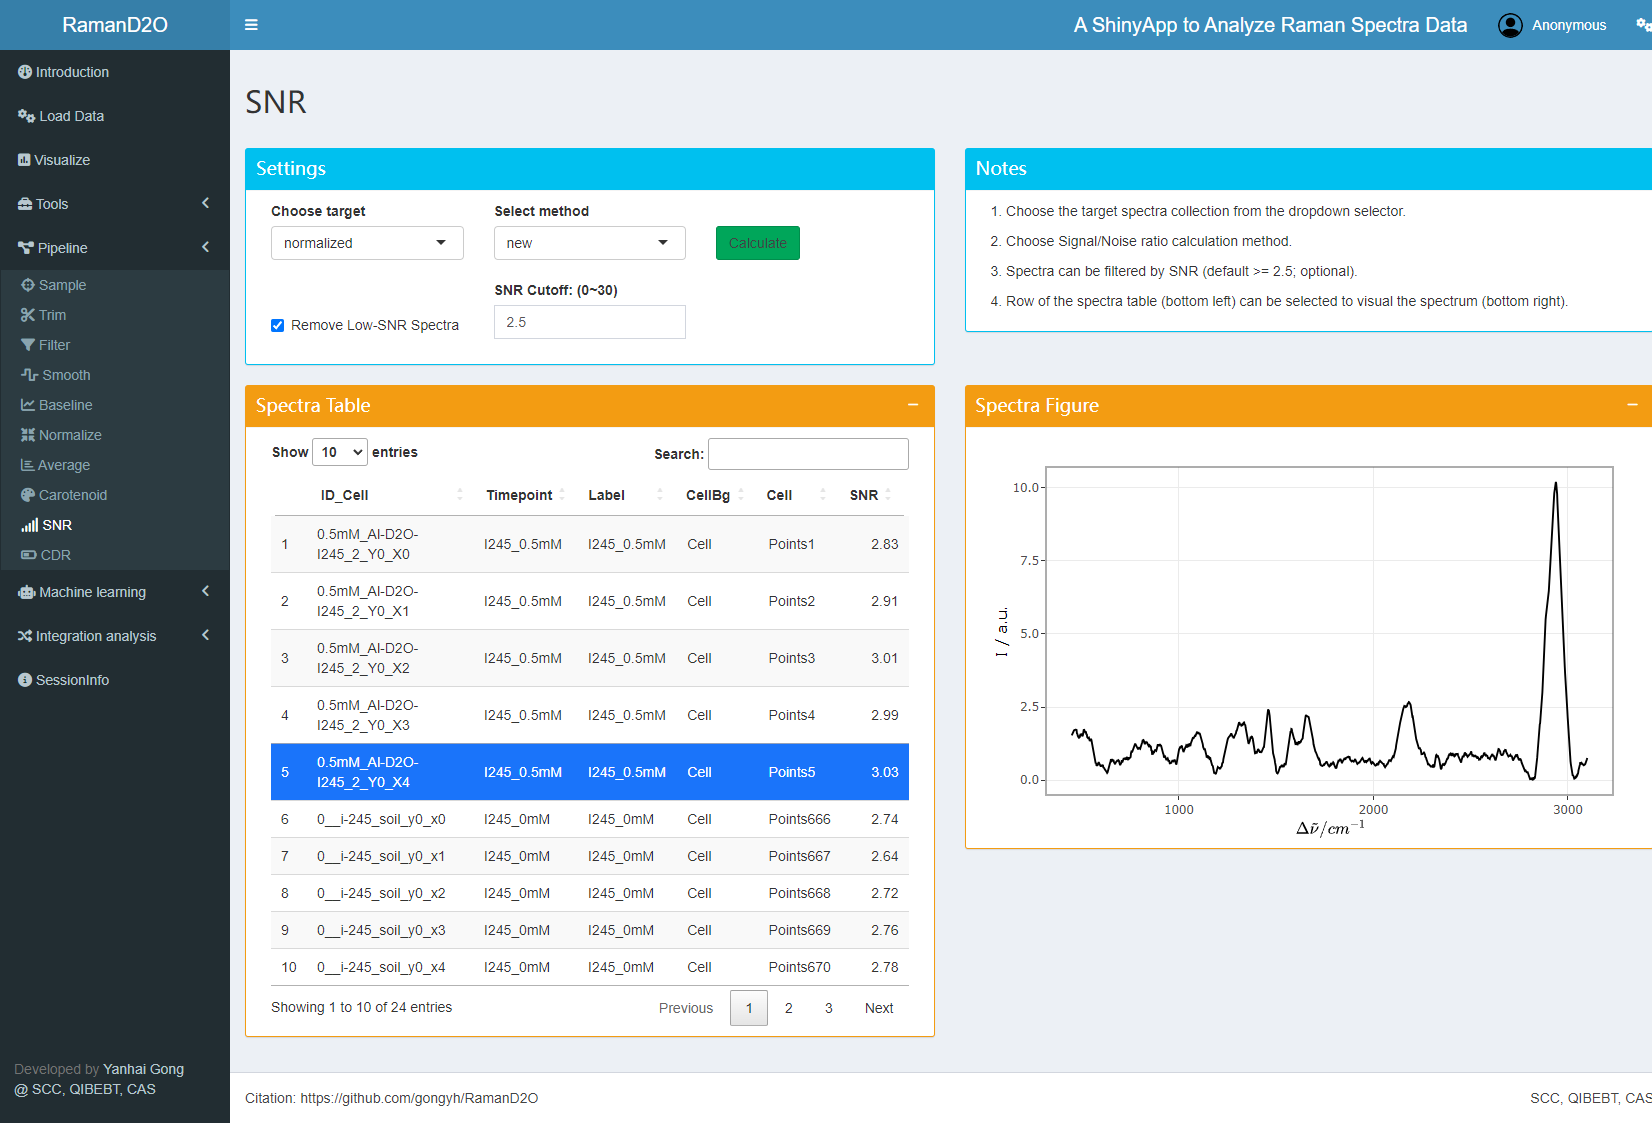
User interface of SNR calculation
7. CDR calculation
CDR of each spectra are calculated. As expected, all the spectra have D2O Raman peaks.
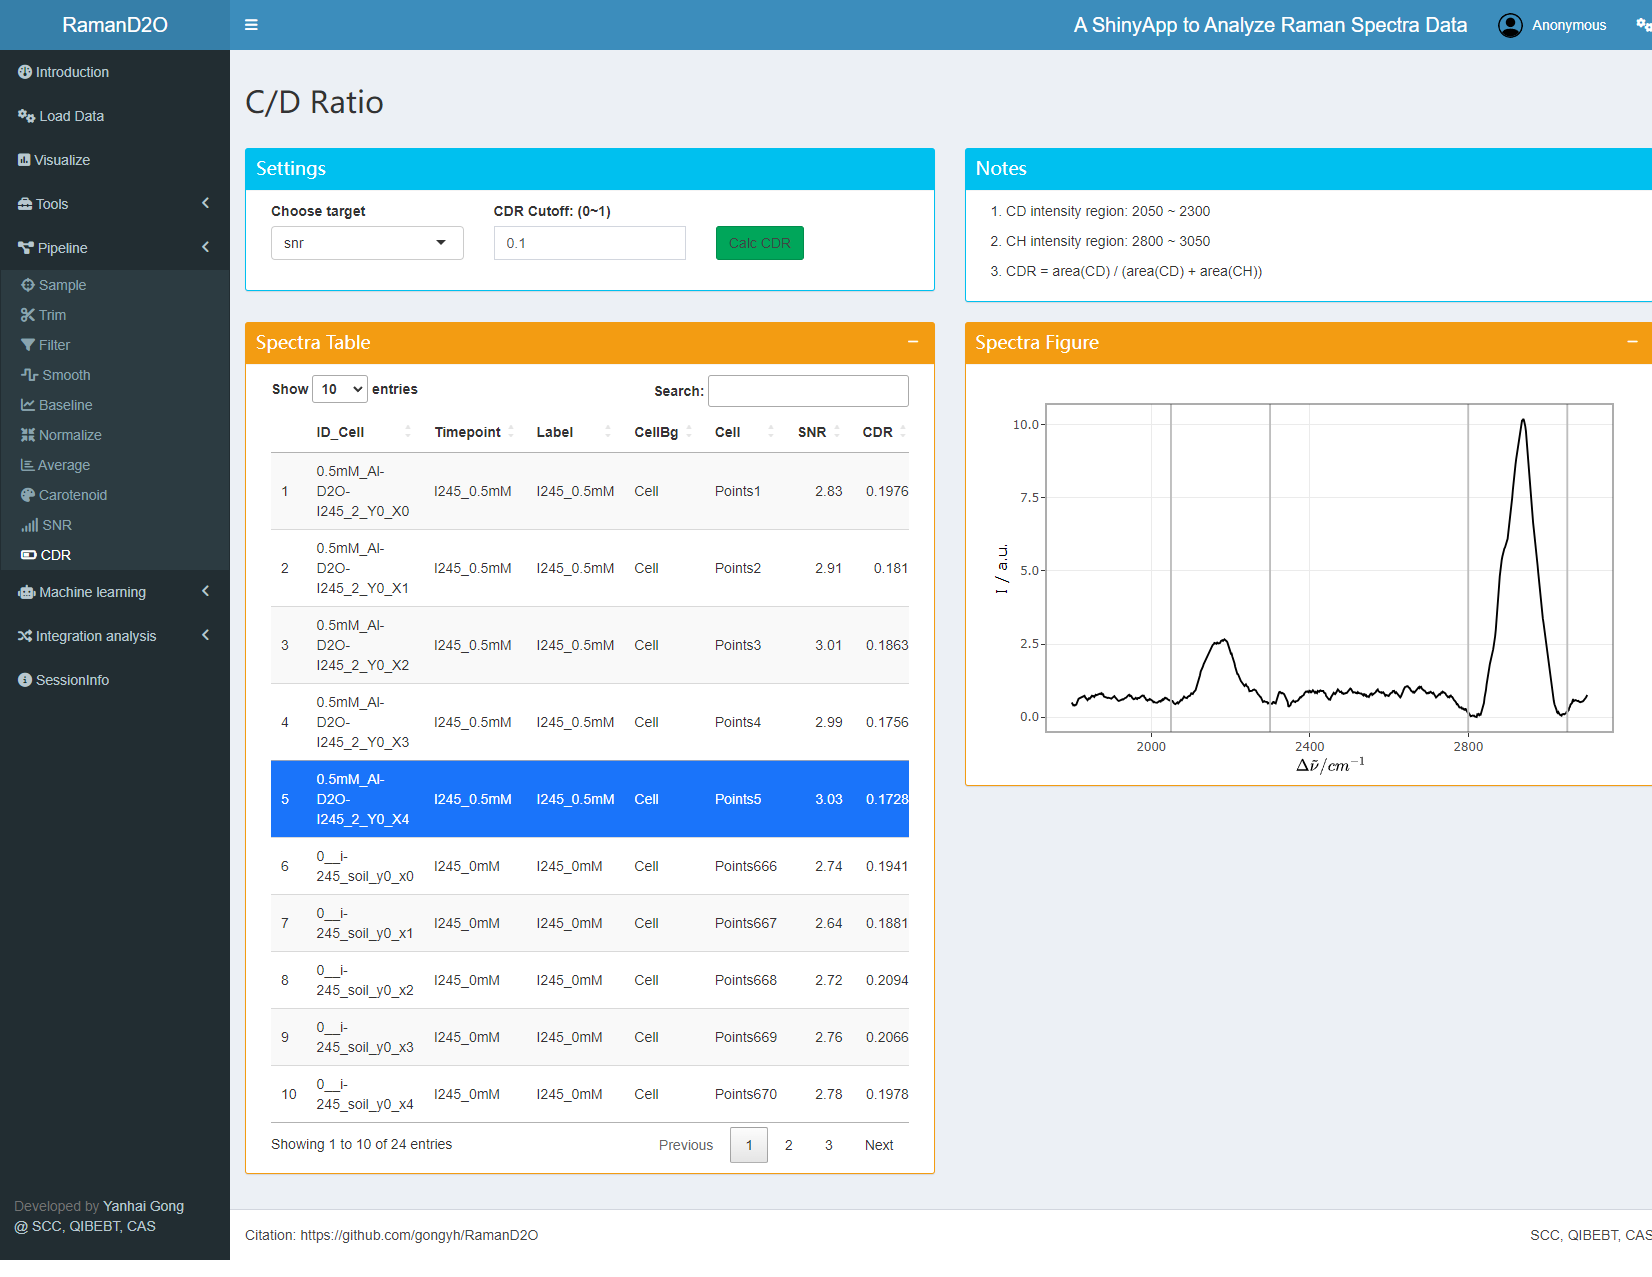
User interface of CDR calculation
8. Visualization
The average spectra and CDR can be visualized and compared.
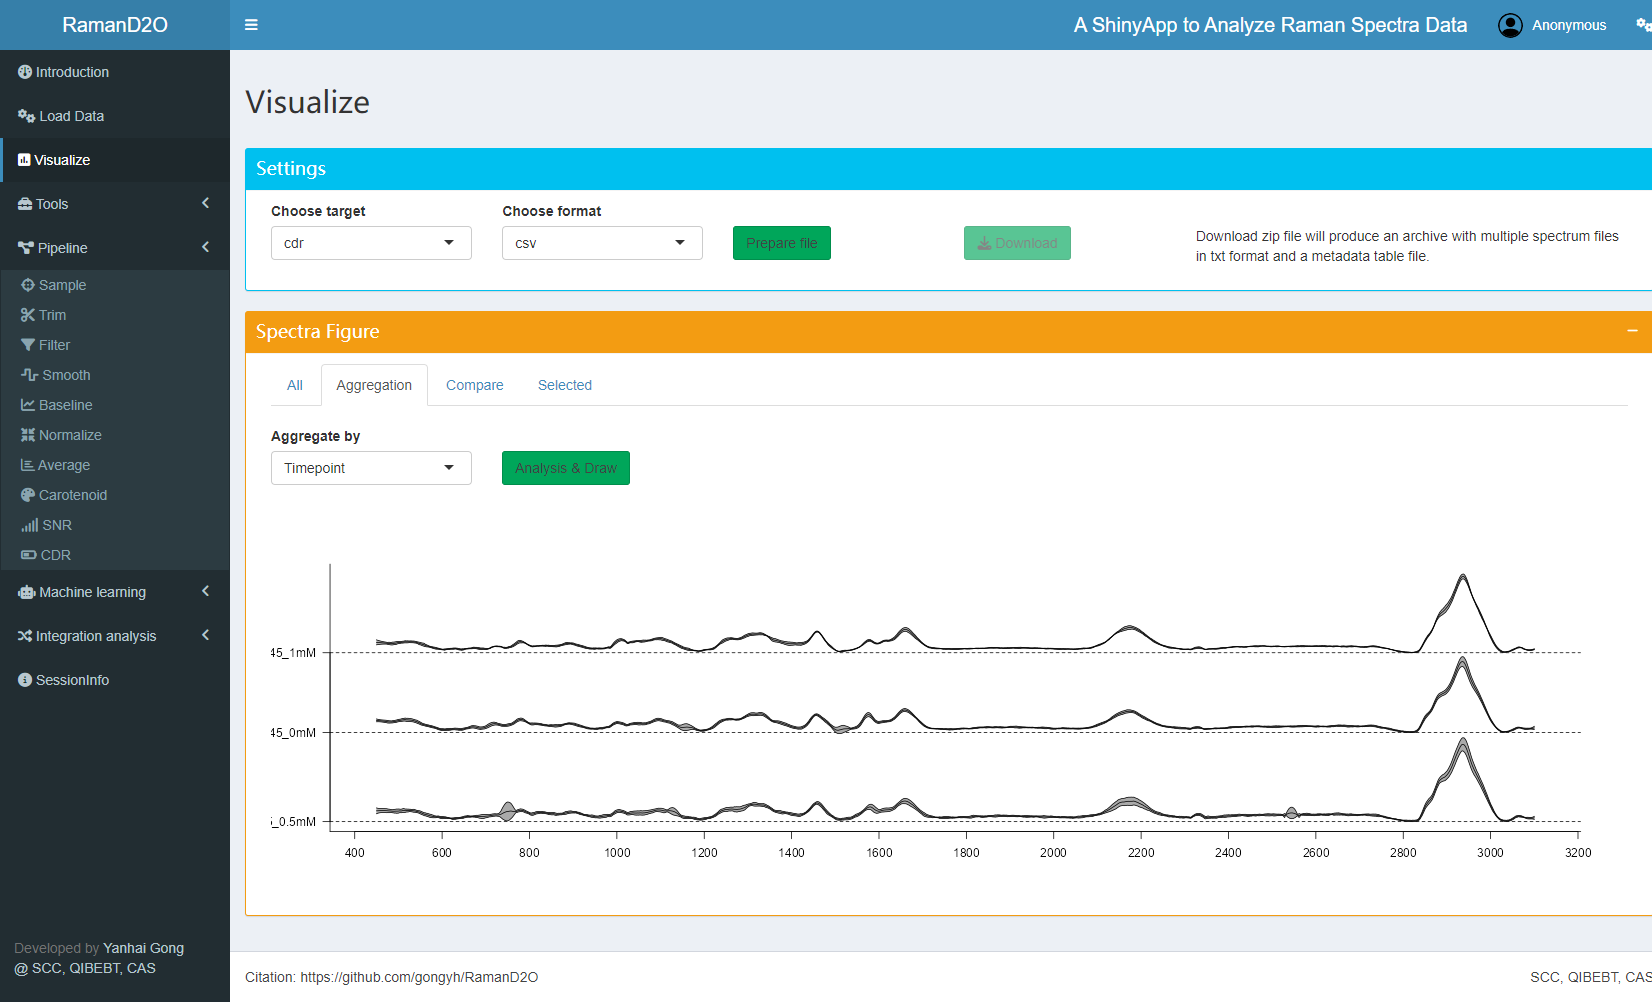
User interface of Visualize
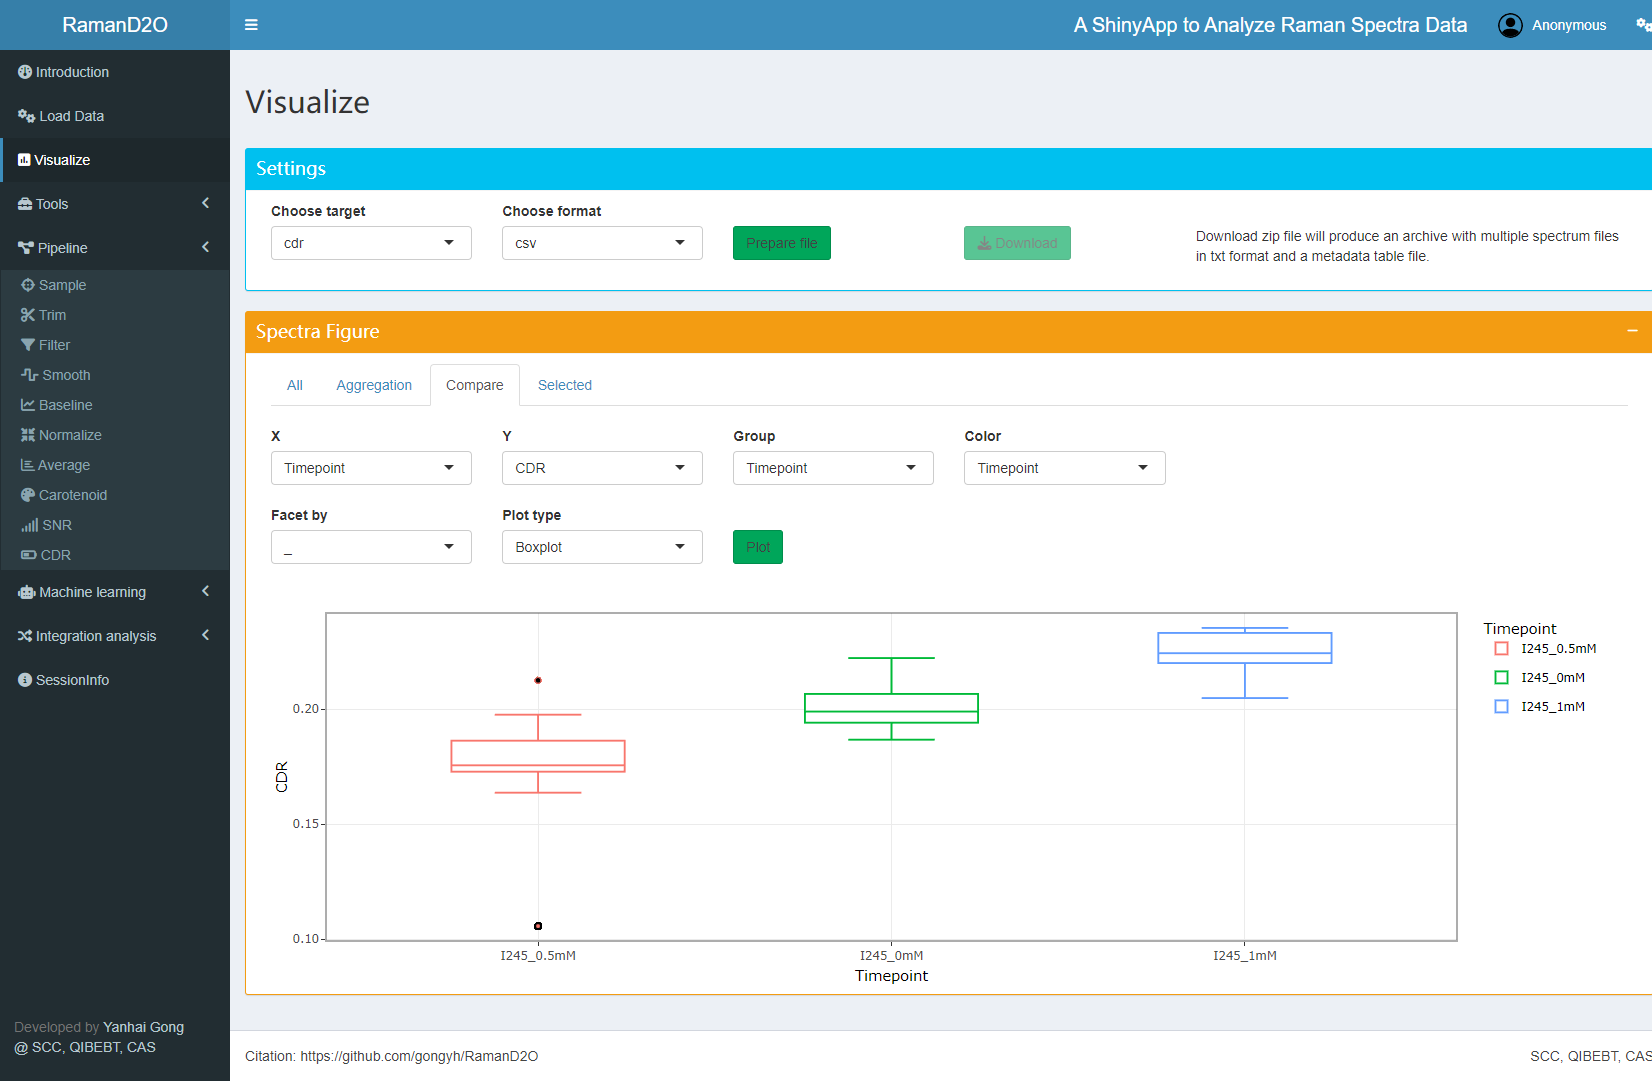
User interface of Visualize